DynaCITY Web Simulator
A browser-based 3D model of Beirut for exploring traffic, pedestrian flows, and street interventions.
John Kofdarelli · Vertically Integrated Projects (VIP)
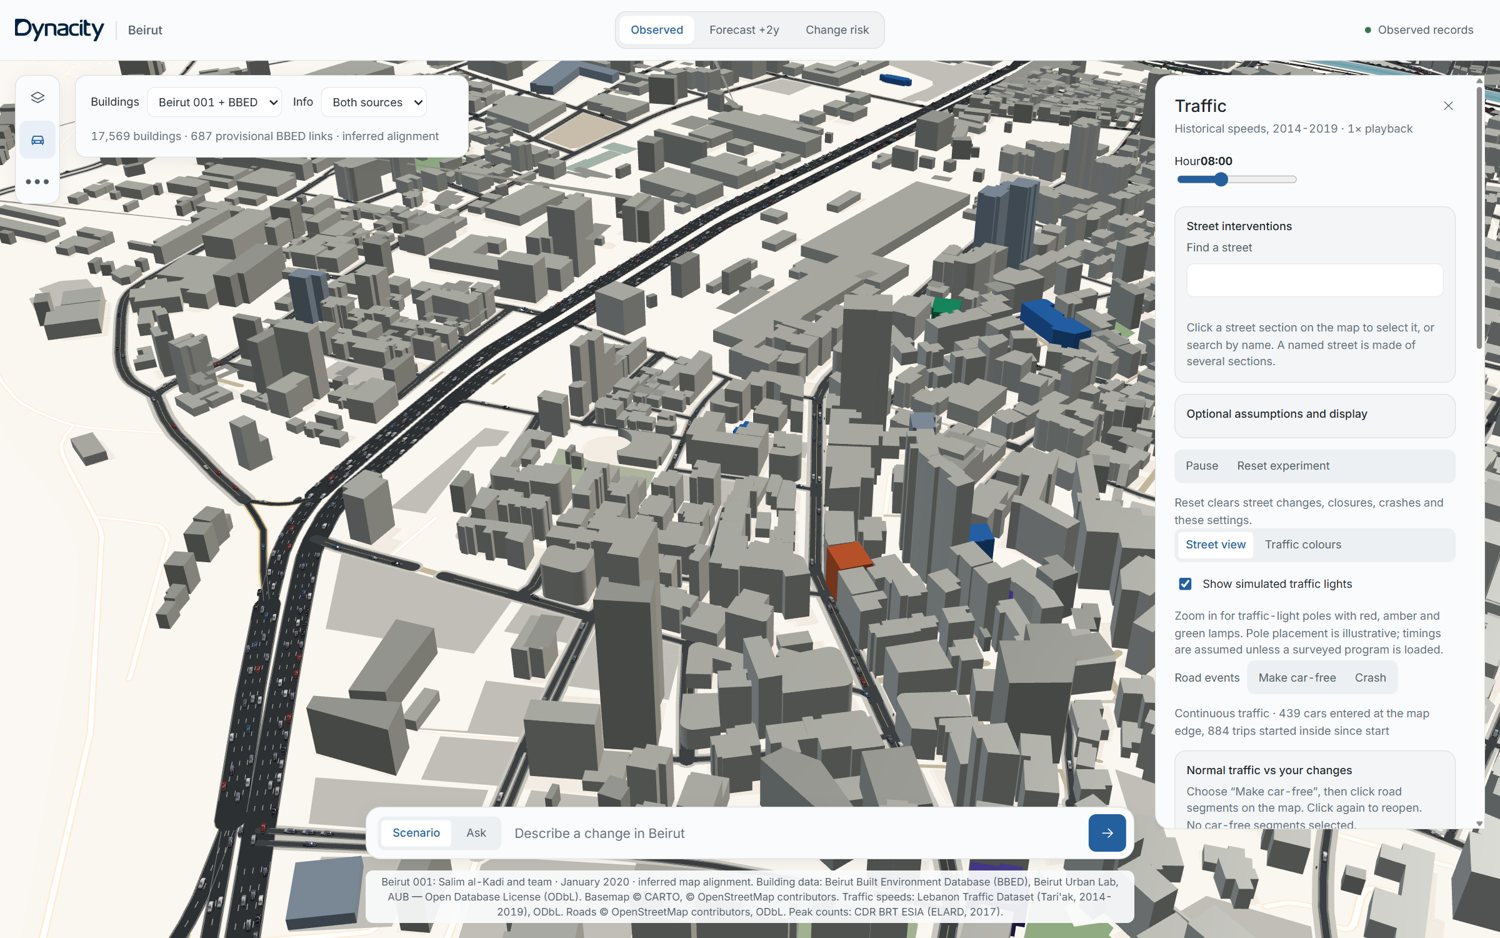
What happens when a street changes?
Closing a road, reducing a speed limit, or giving a traffic lane to pedestrians affects the streets around it. DynaCITY brings building surveys, mapped infrastructure, historical traffic data, and simulation into one interface to explore those effects alongside a baseline scenario.
From city data to simulation
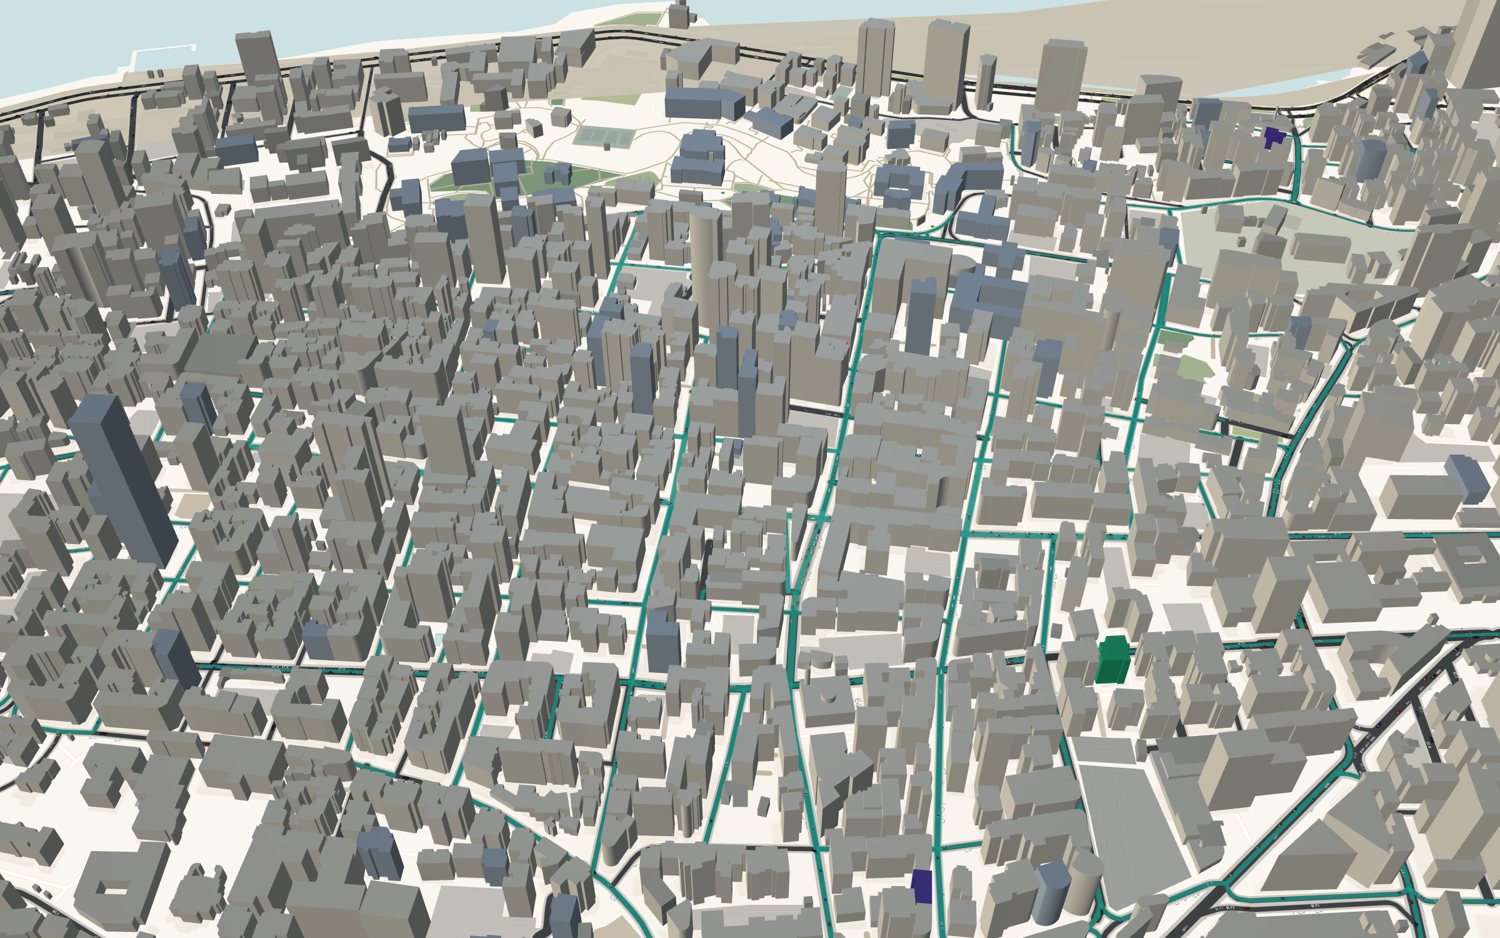
- Combine OpenStreetMap roads and context with 3,349 surveyed BBED buildings, the Beirut 001 city model, and Overture footprints for surrounding areas.
- Drive individual vehicles with Eclipse SUMO through a Python/FastAPI server; render the city with MapLibre GL and deck.gl.
- Use Tari'ak historical speeds and CDR peak-hour counts to inform traffic assumptions, and Urban Network Analysis to estimate pedestrian flows.
Street experiments
- Explore hourly traffic patterns and introduce road closures or crash events.
- Compare a changed network with a parallel baseline, tracking rerouted vehicles, queues, and completed-trip delays.
- Pedestrianise a street section, cap its speed, or reallocate a curb lane to pavement space, then inspect the modelled indicators.
Scope and interpretation
This is an exploratory research prototype. Traffic inputs use historical speeds from 2014–2019 and counts from 2016–2017. Some building heights, road dimensions, and travel demand are estimated. Pedestrian flows are modelled, and the animated walkers are illustrative. Scenario outputs should be read as model behaviour, rather than validated predictions of present-day conditions or measured safety improvements.